Skip to main contentData Graph provides a clear, visual overview of your data flow—from source to table to query.
This is accessible via “Data Graph” on the left navigation bar.
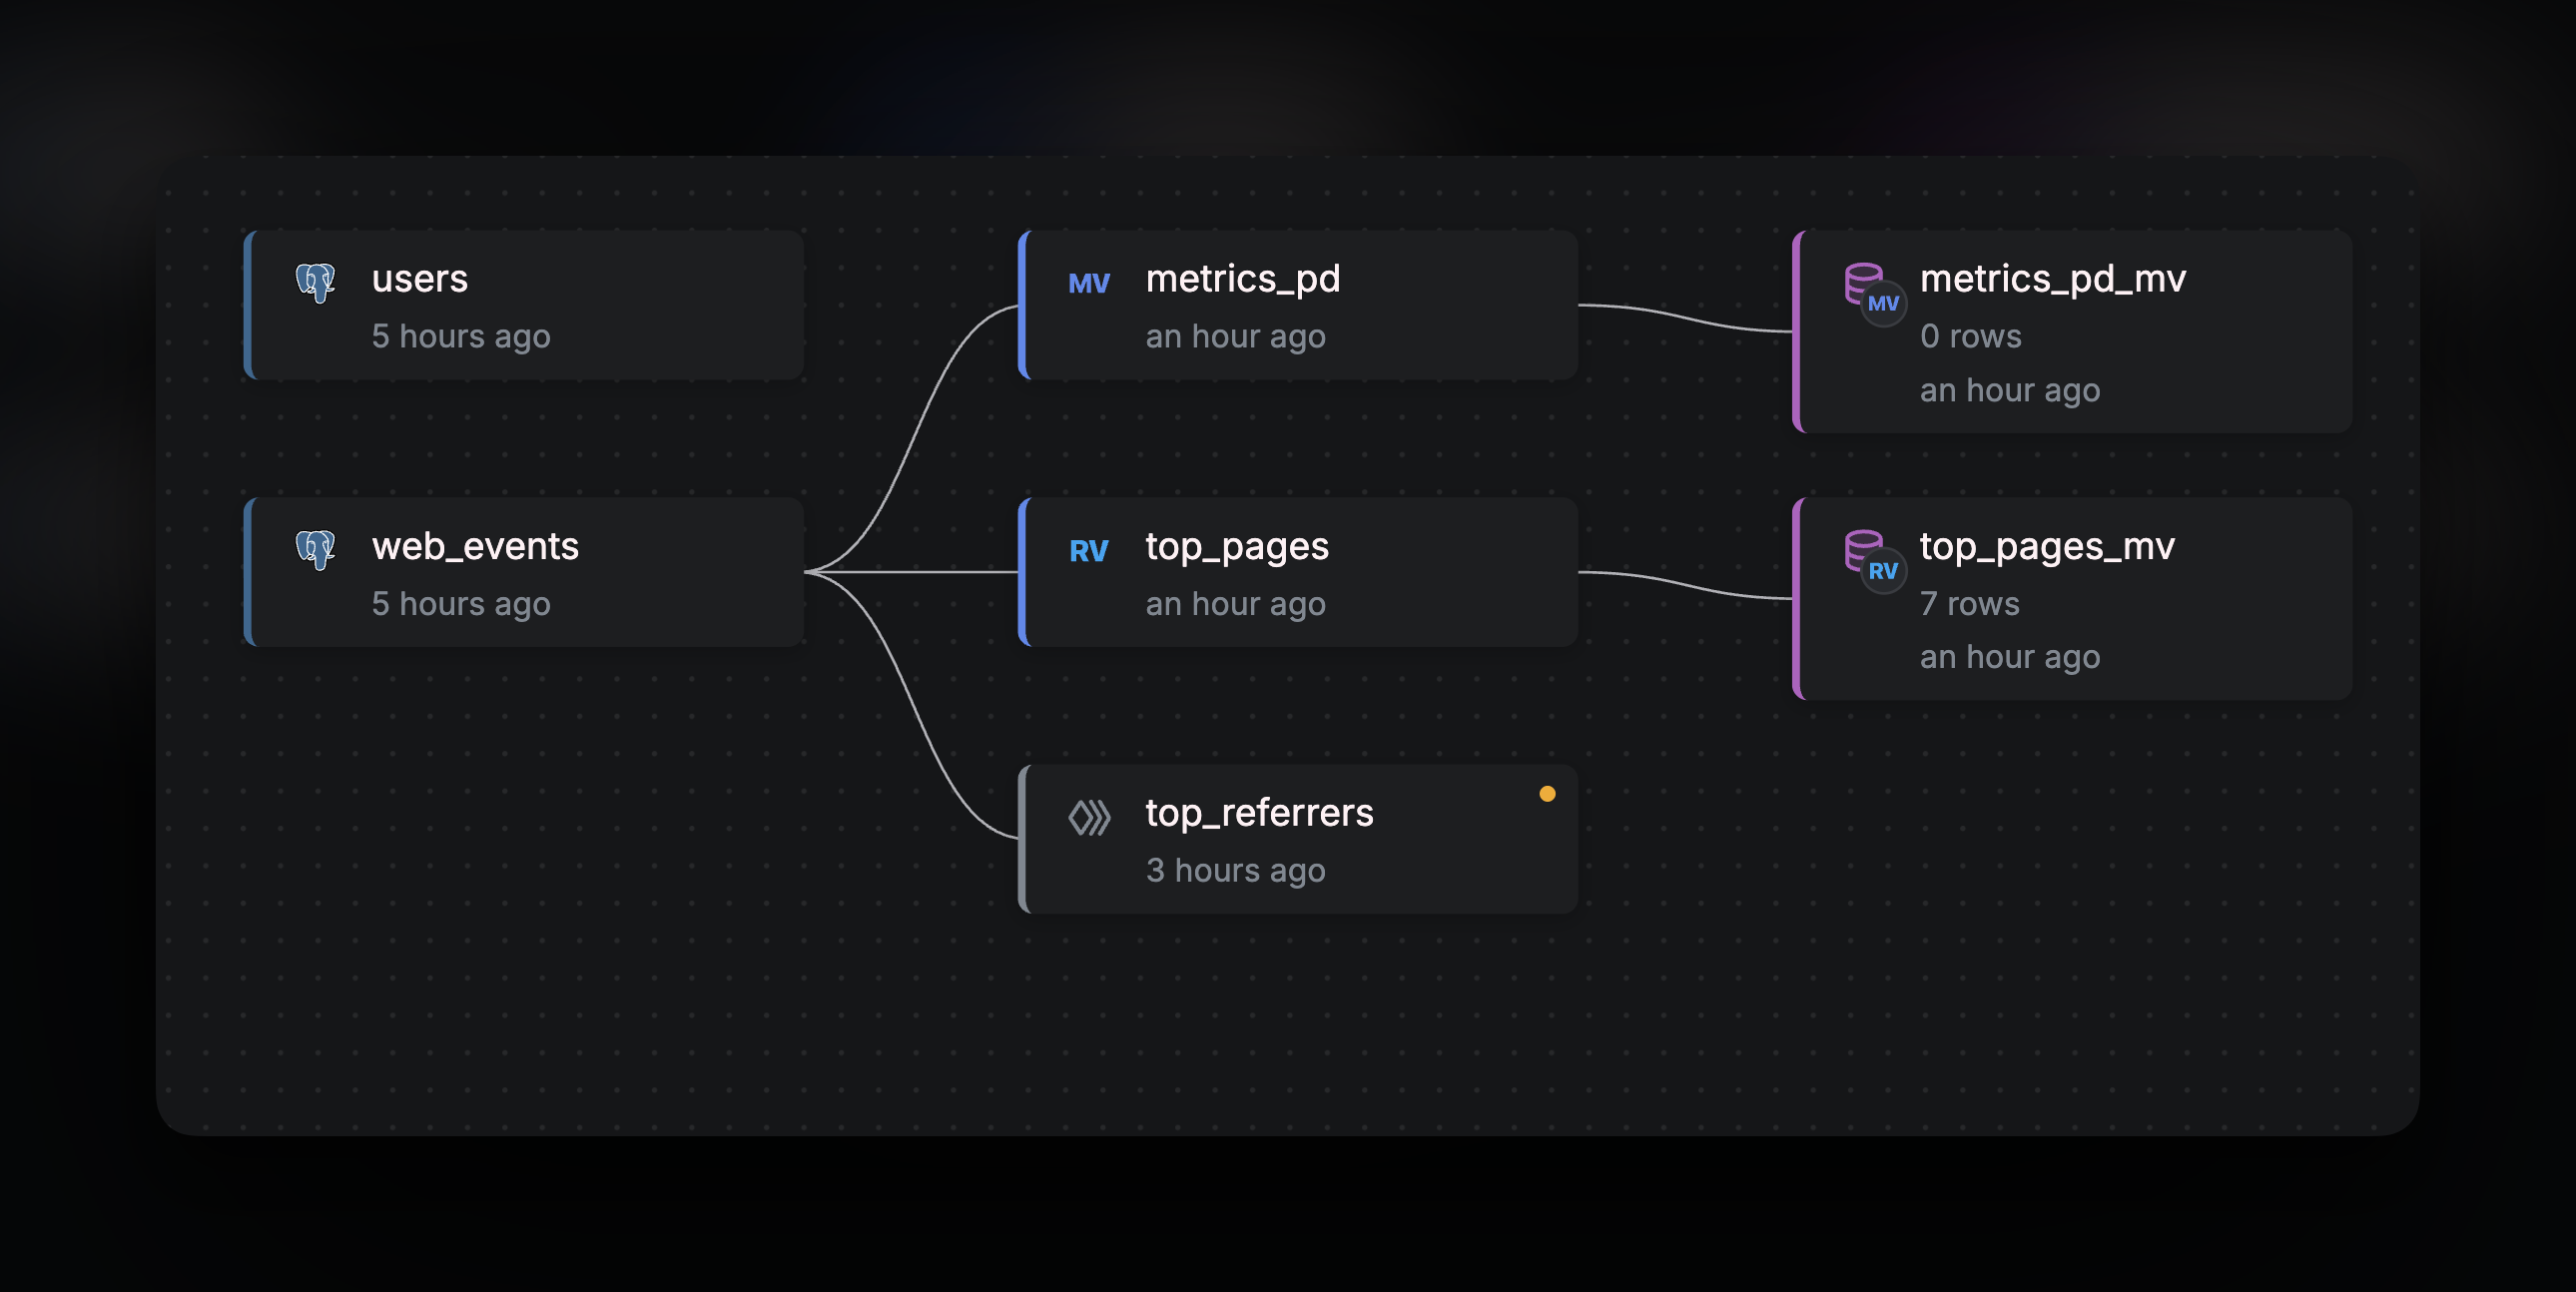 This feature is especially helpful in complex workspaces with multiple tables and queries, offering an intuitive way to track your data’s journey in one view.
You can also interact with elements directly by clicking on them, making it easy to navigate and manage your data pipeline.
This feature is especially helpful in complex workspaces with multiple tables and queries, offering an intuitive way to track your data’s journey in one view.
You can also interact with elements directly by clicking on them, making it easy to navigate and manage your data pipeline.
CLI
To get the data graph in JSON format, just run and you will get the whole graph in JSON format: