- Creating a workspace
- Uploading a CSV file
- Writing queries as features
- Exposing the features through an API
Create a Workspace
We start by creating a new workspace. If this is your first time using Airfold, you will be directed to our welcome page where you can simply type in a name: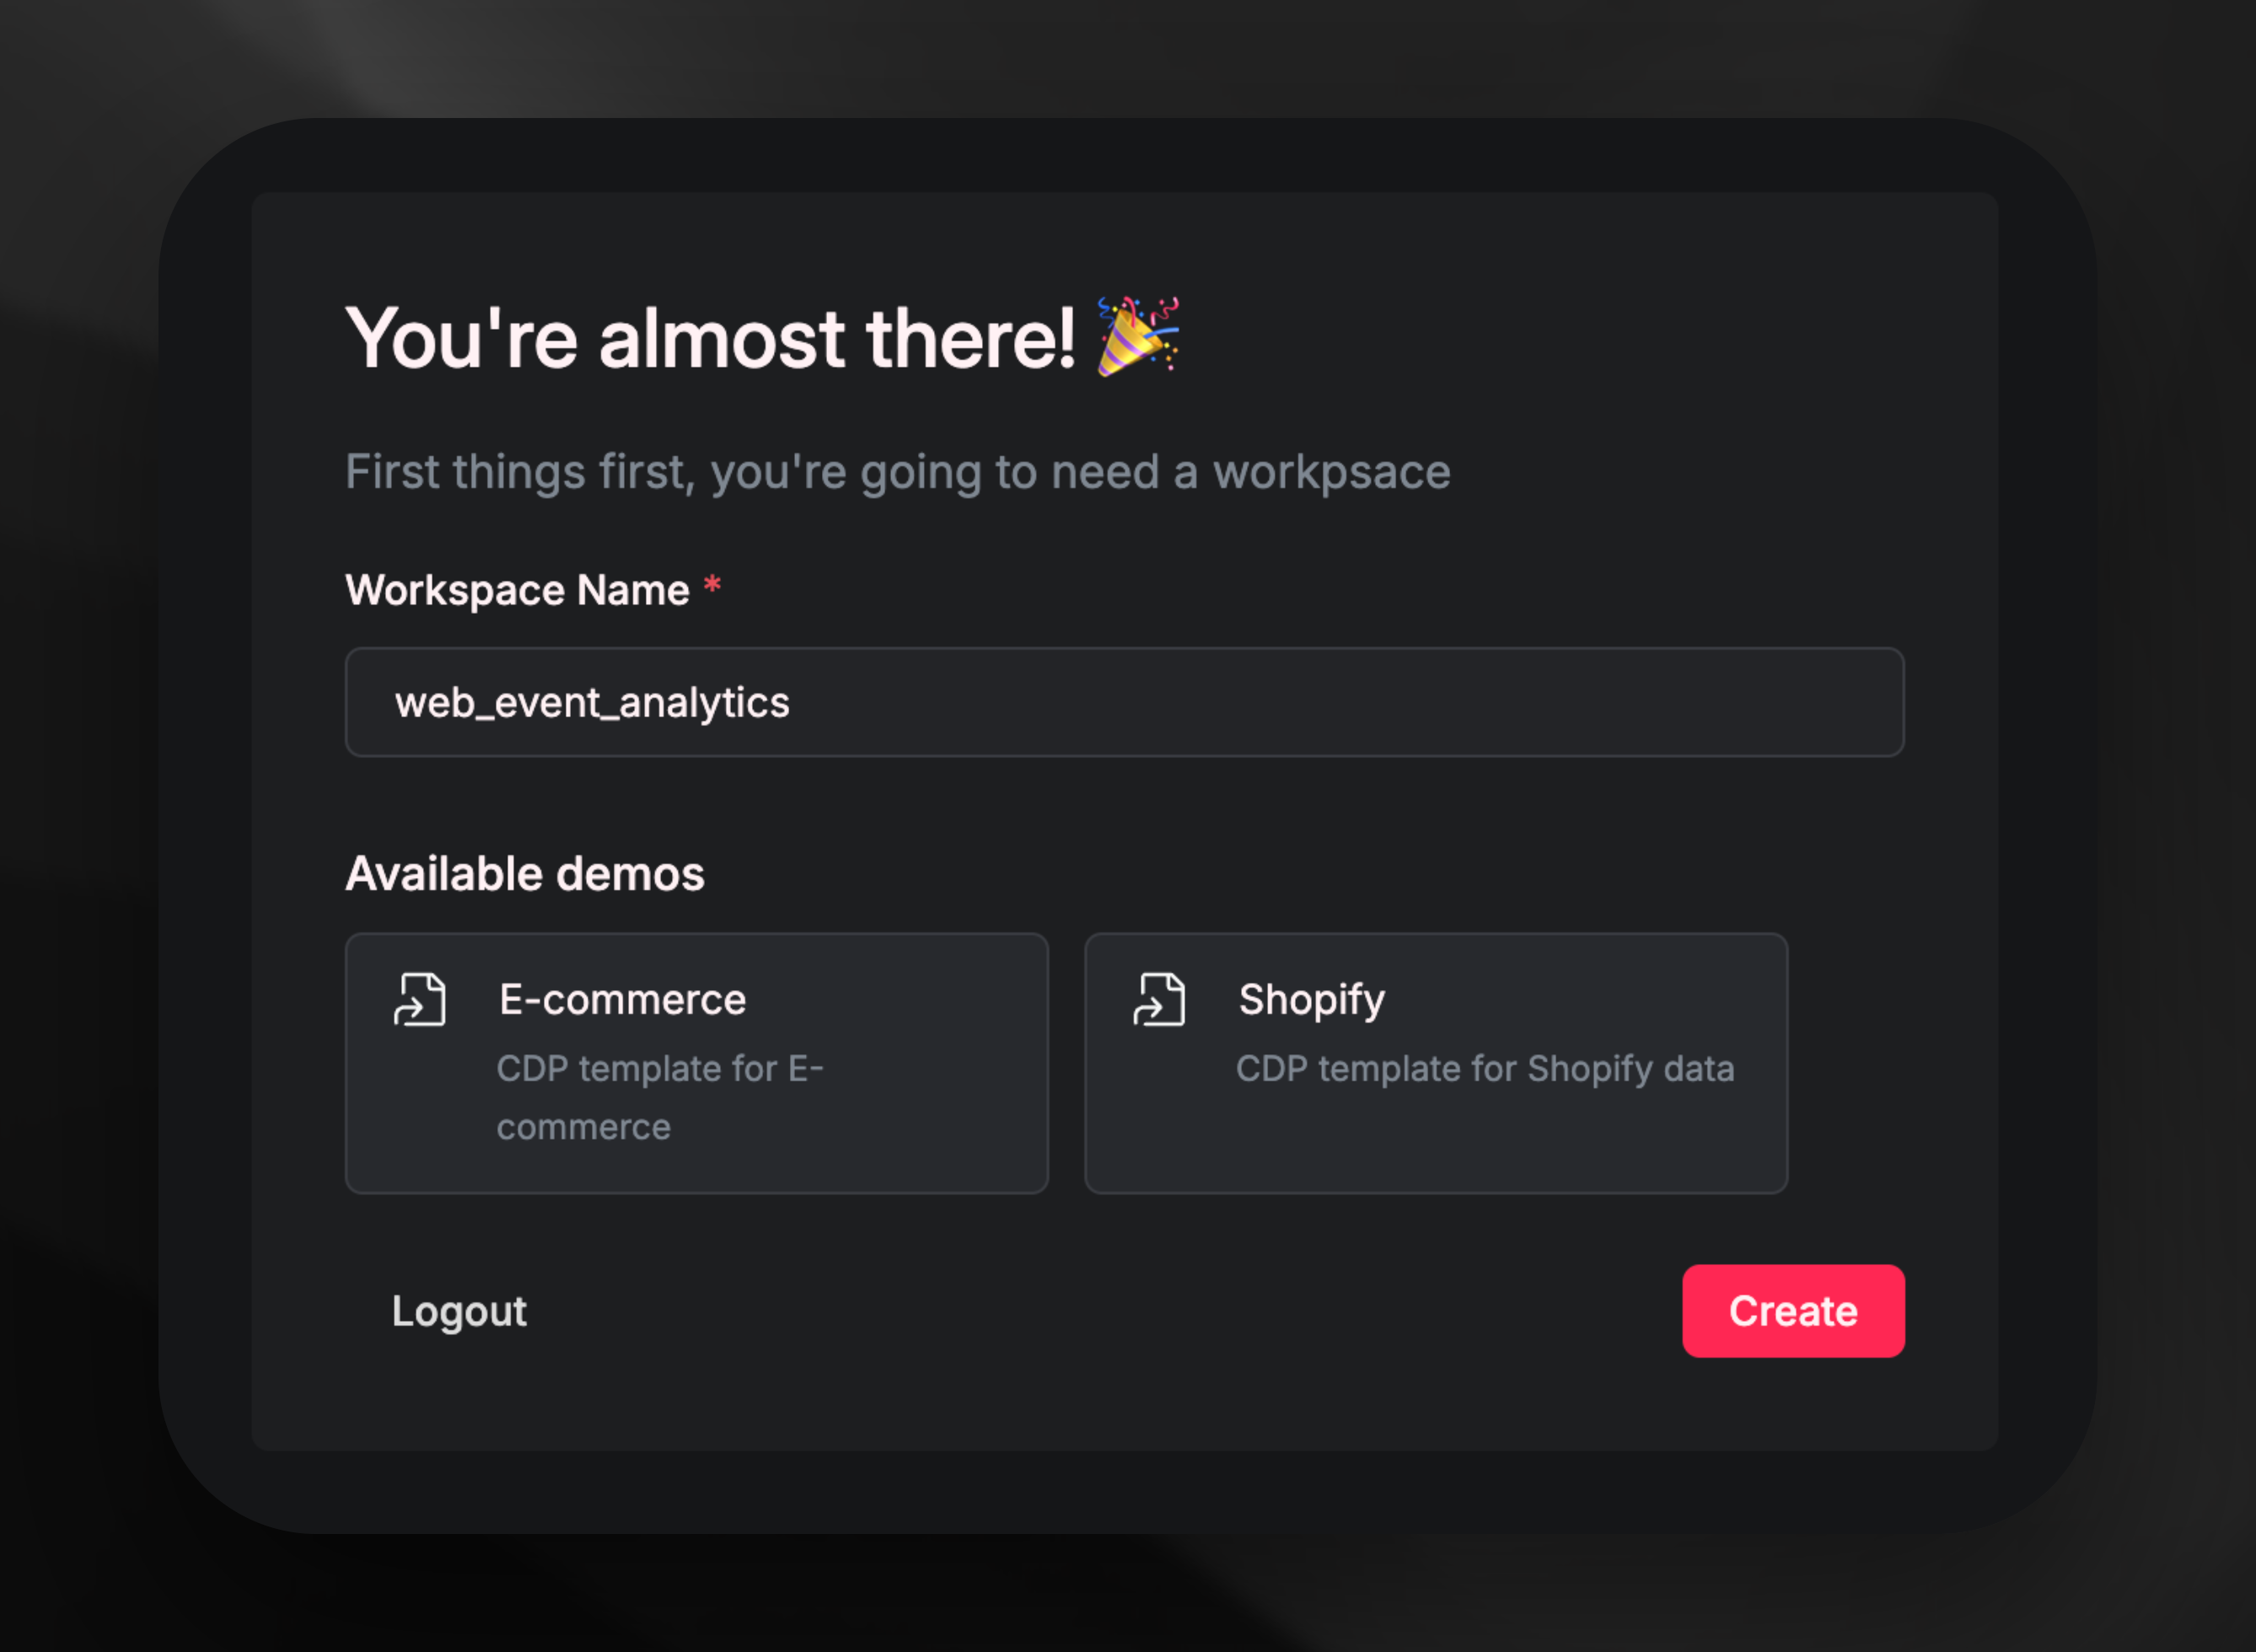 Otherwise, you can create a new workspace by clicking on the top-left corner, then
”+ New Workspace”:
Otherwise, you can create a new workspace by clicking on the top-left corner, then
”+ New Workspace”:

Uploading a CSV file
We will be using web events data for this guide, which you can download here. Click on “Sources” on the left column, then select “File upload”: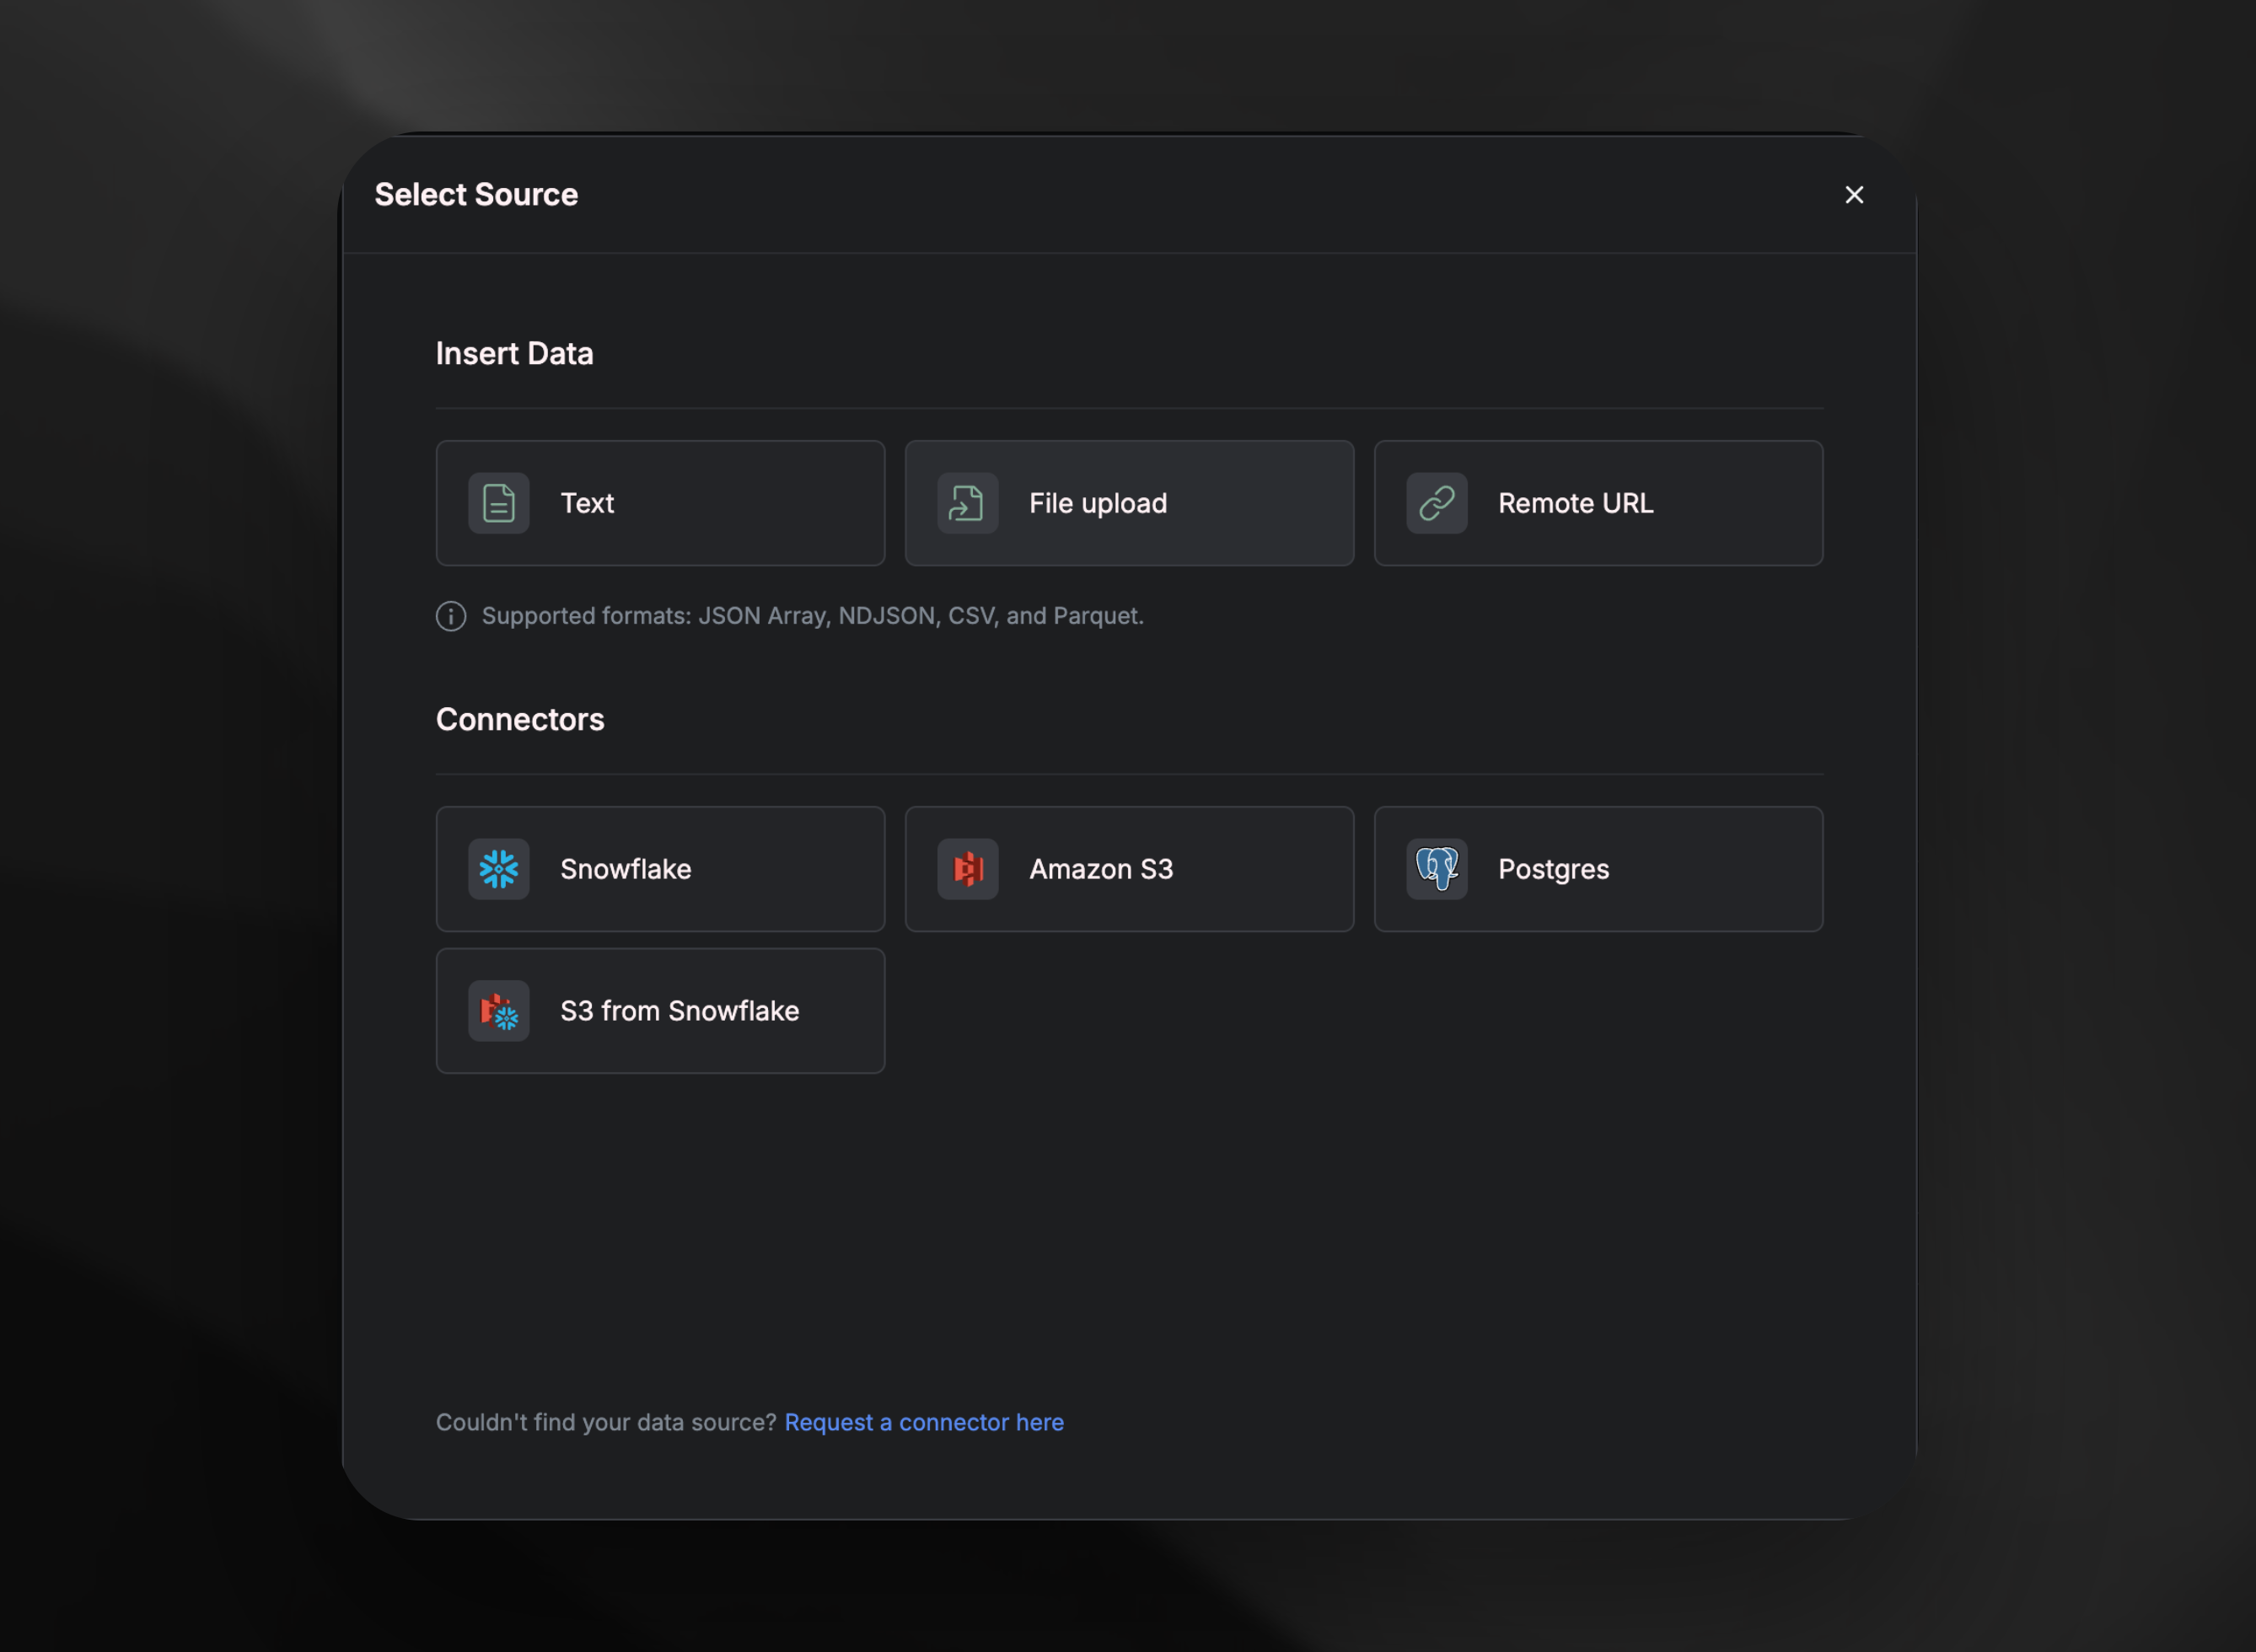 From here, upload the
 web_events_sample.csv file we just downloaded.
Then, name it web_events_sample_csv, and make sure to select the checkbox ingest data before clicking on “Create source.”
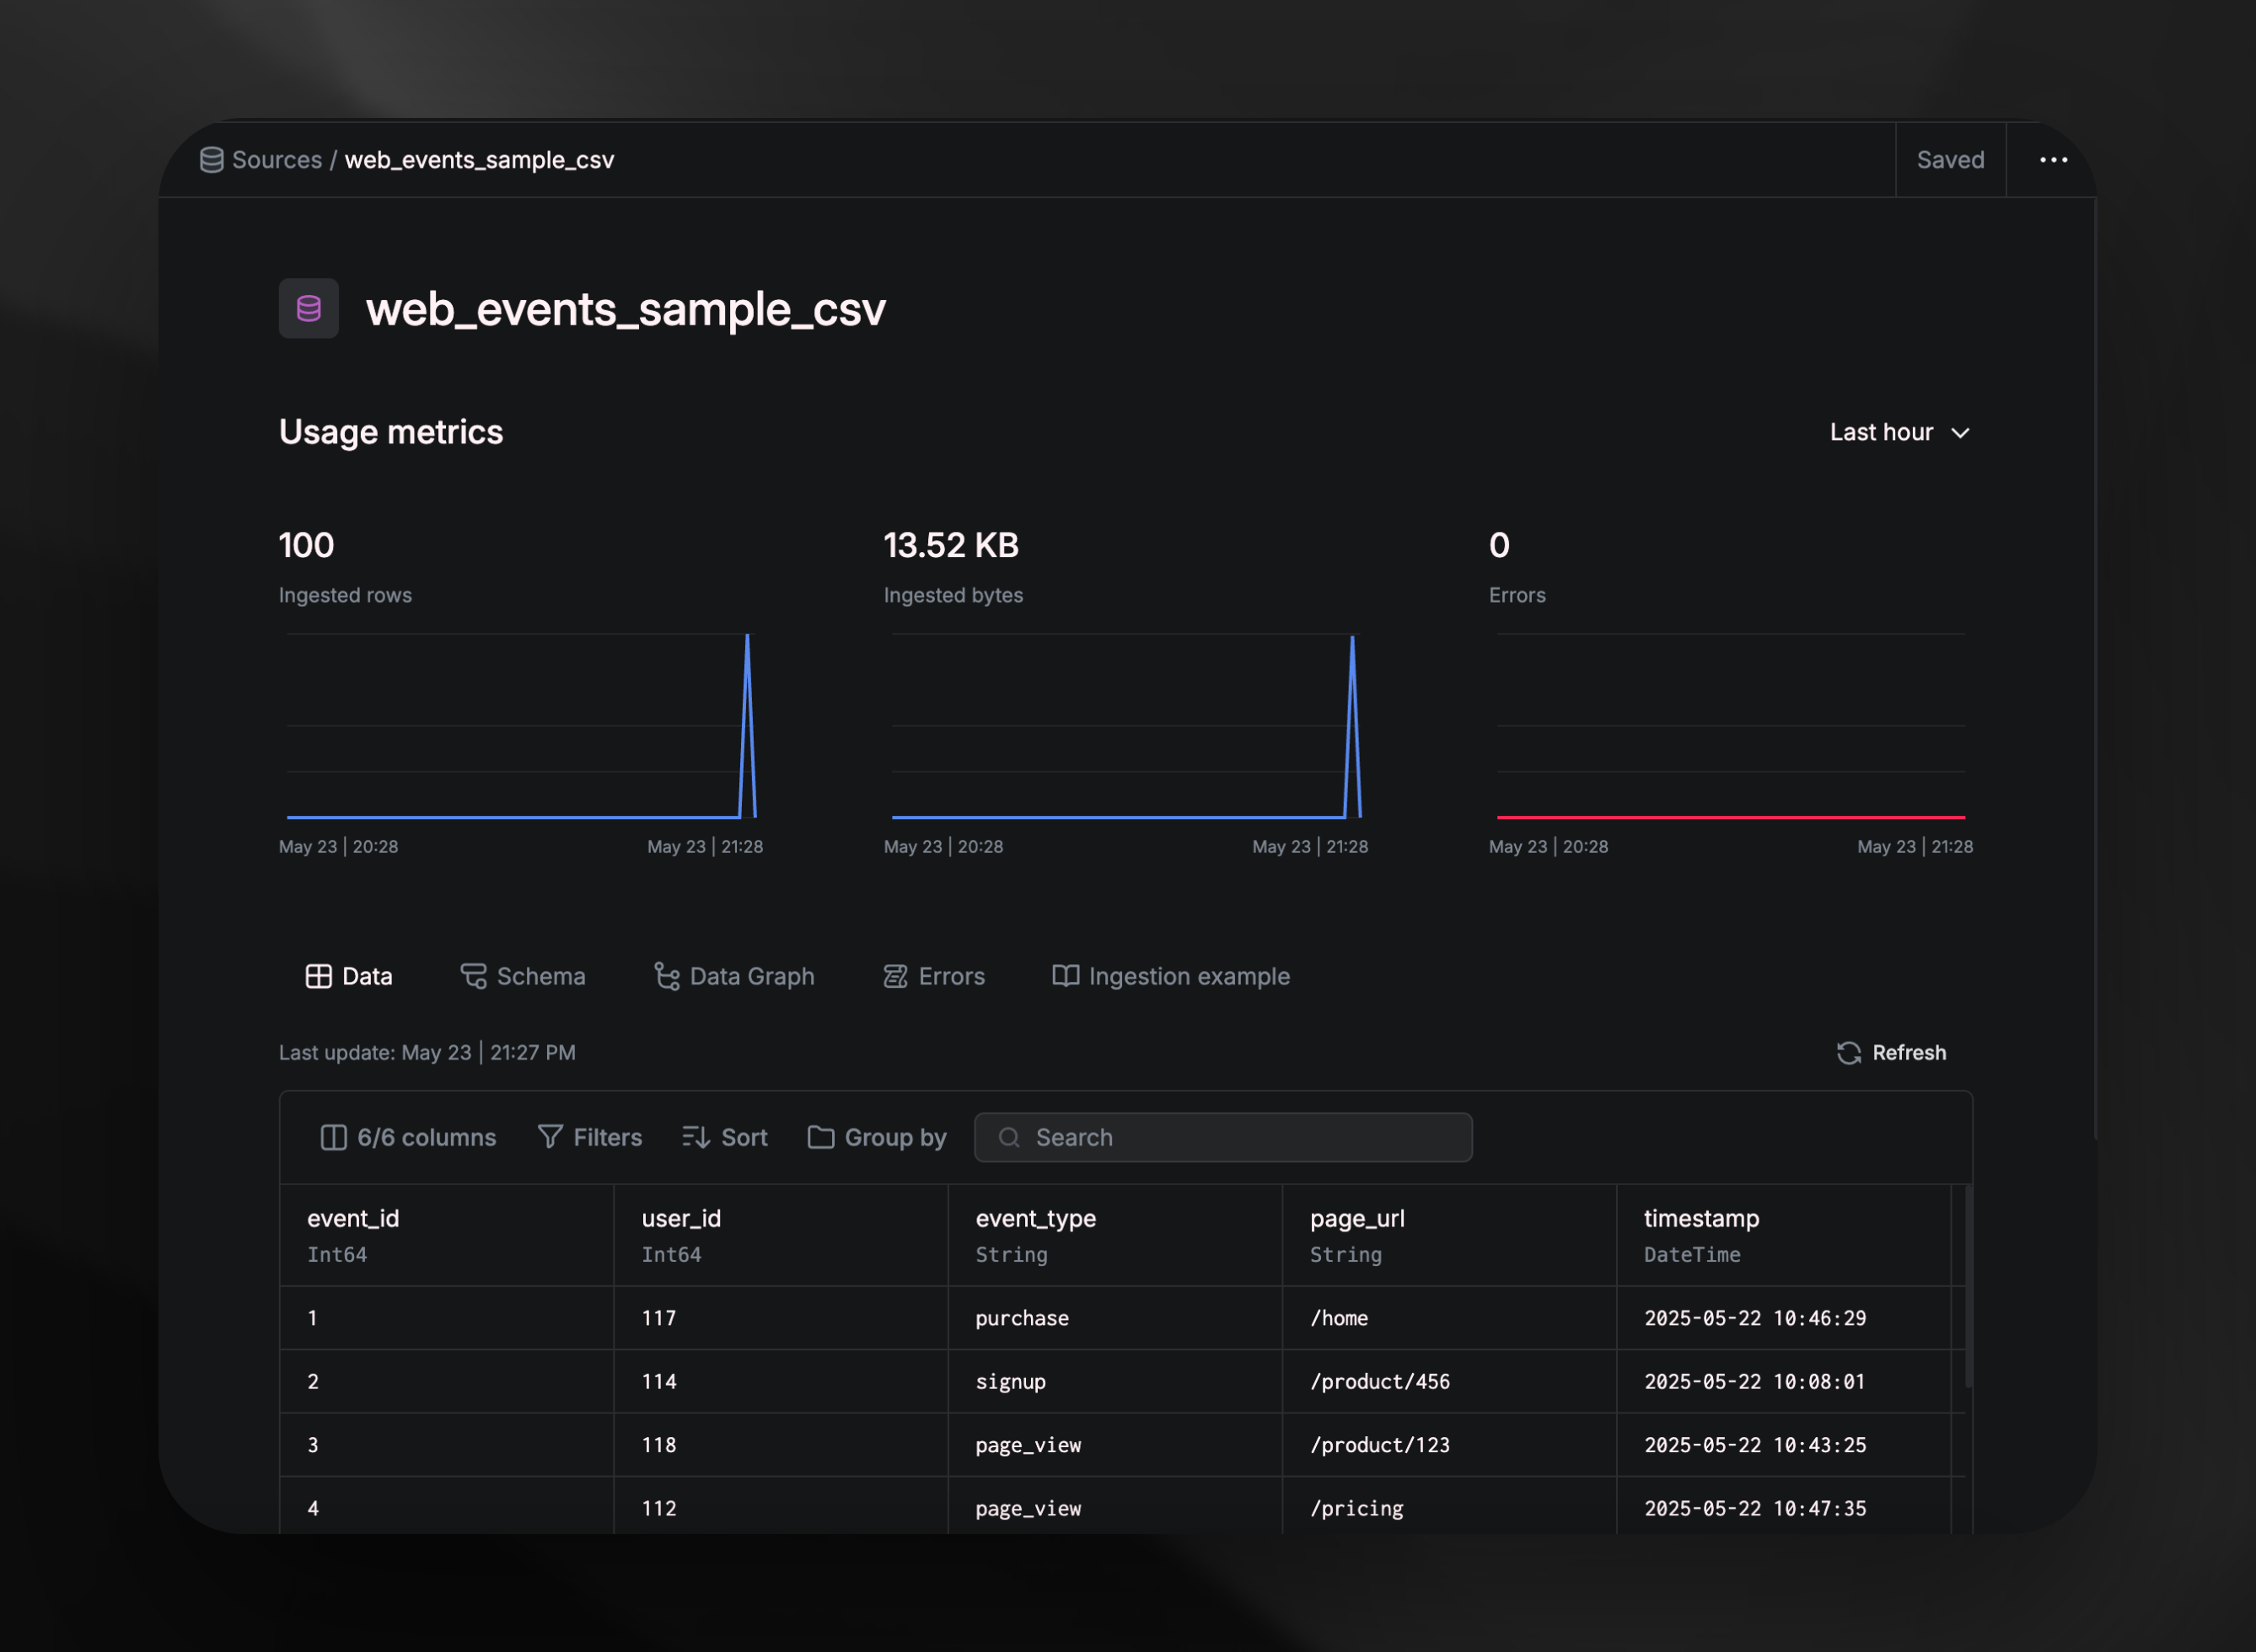
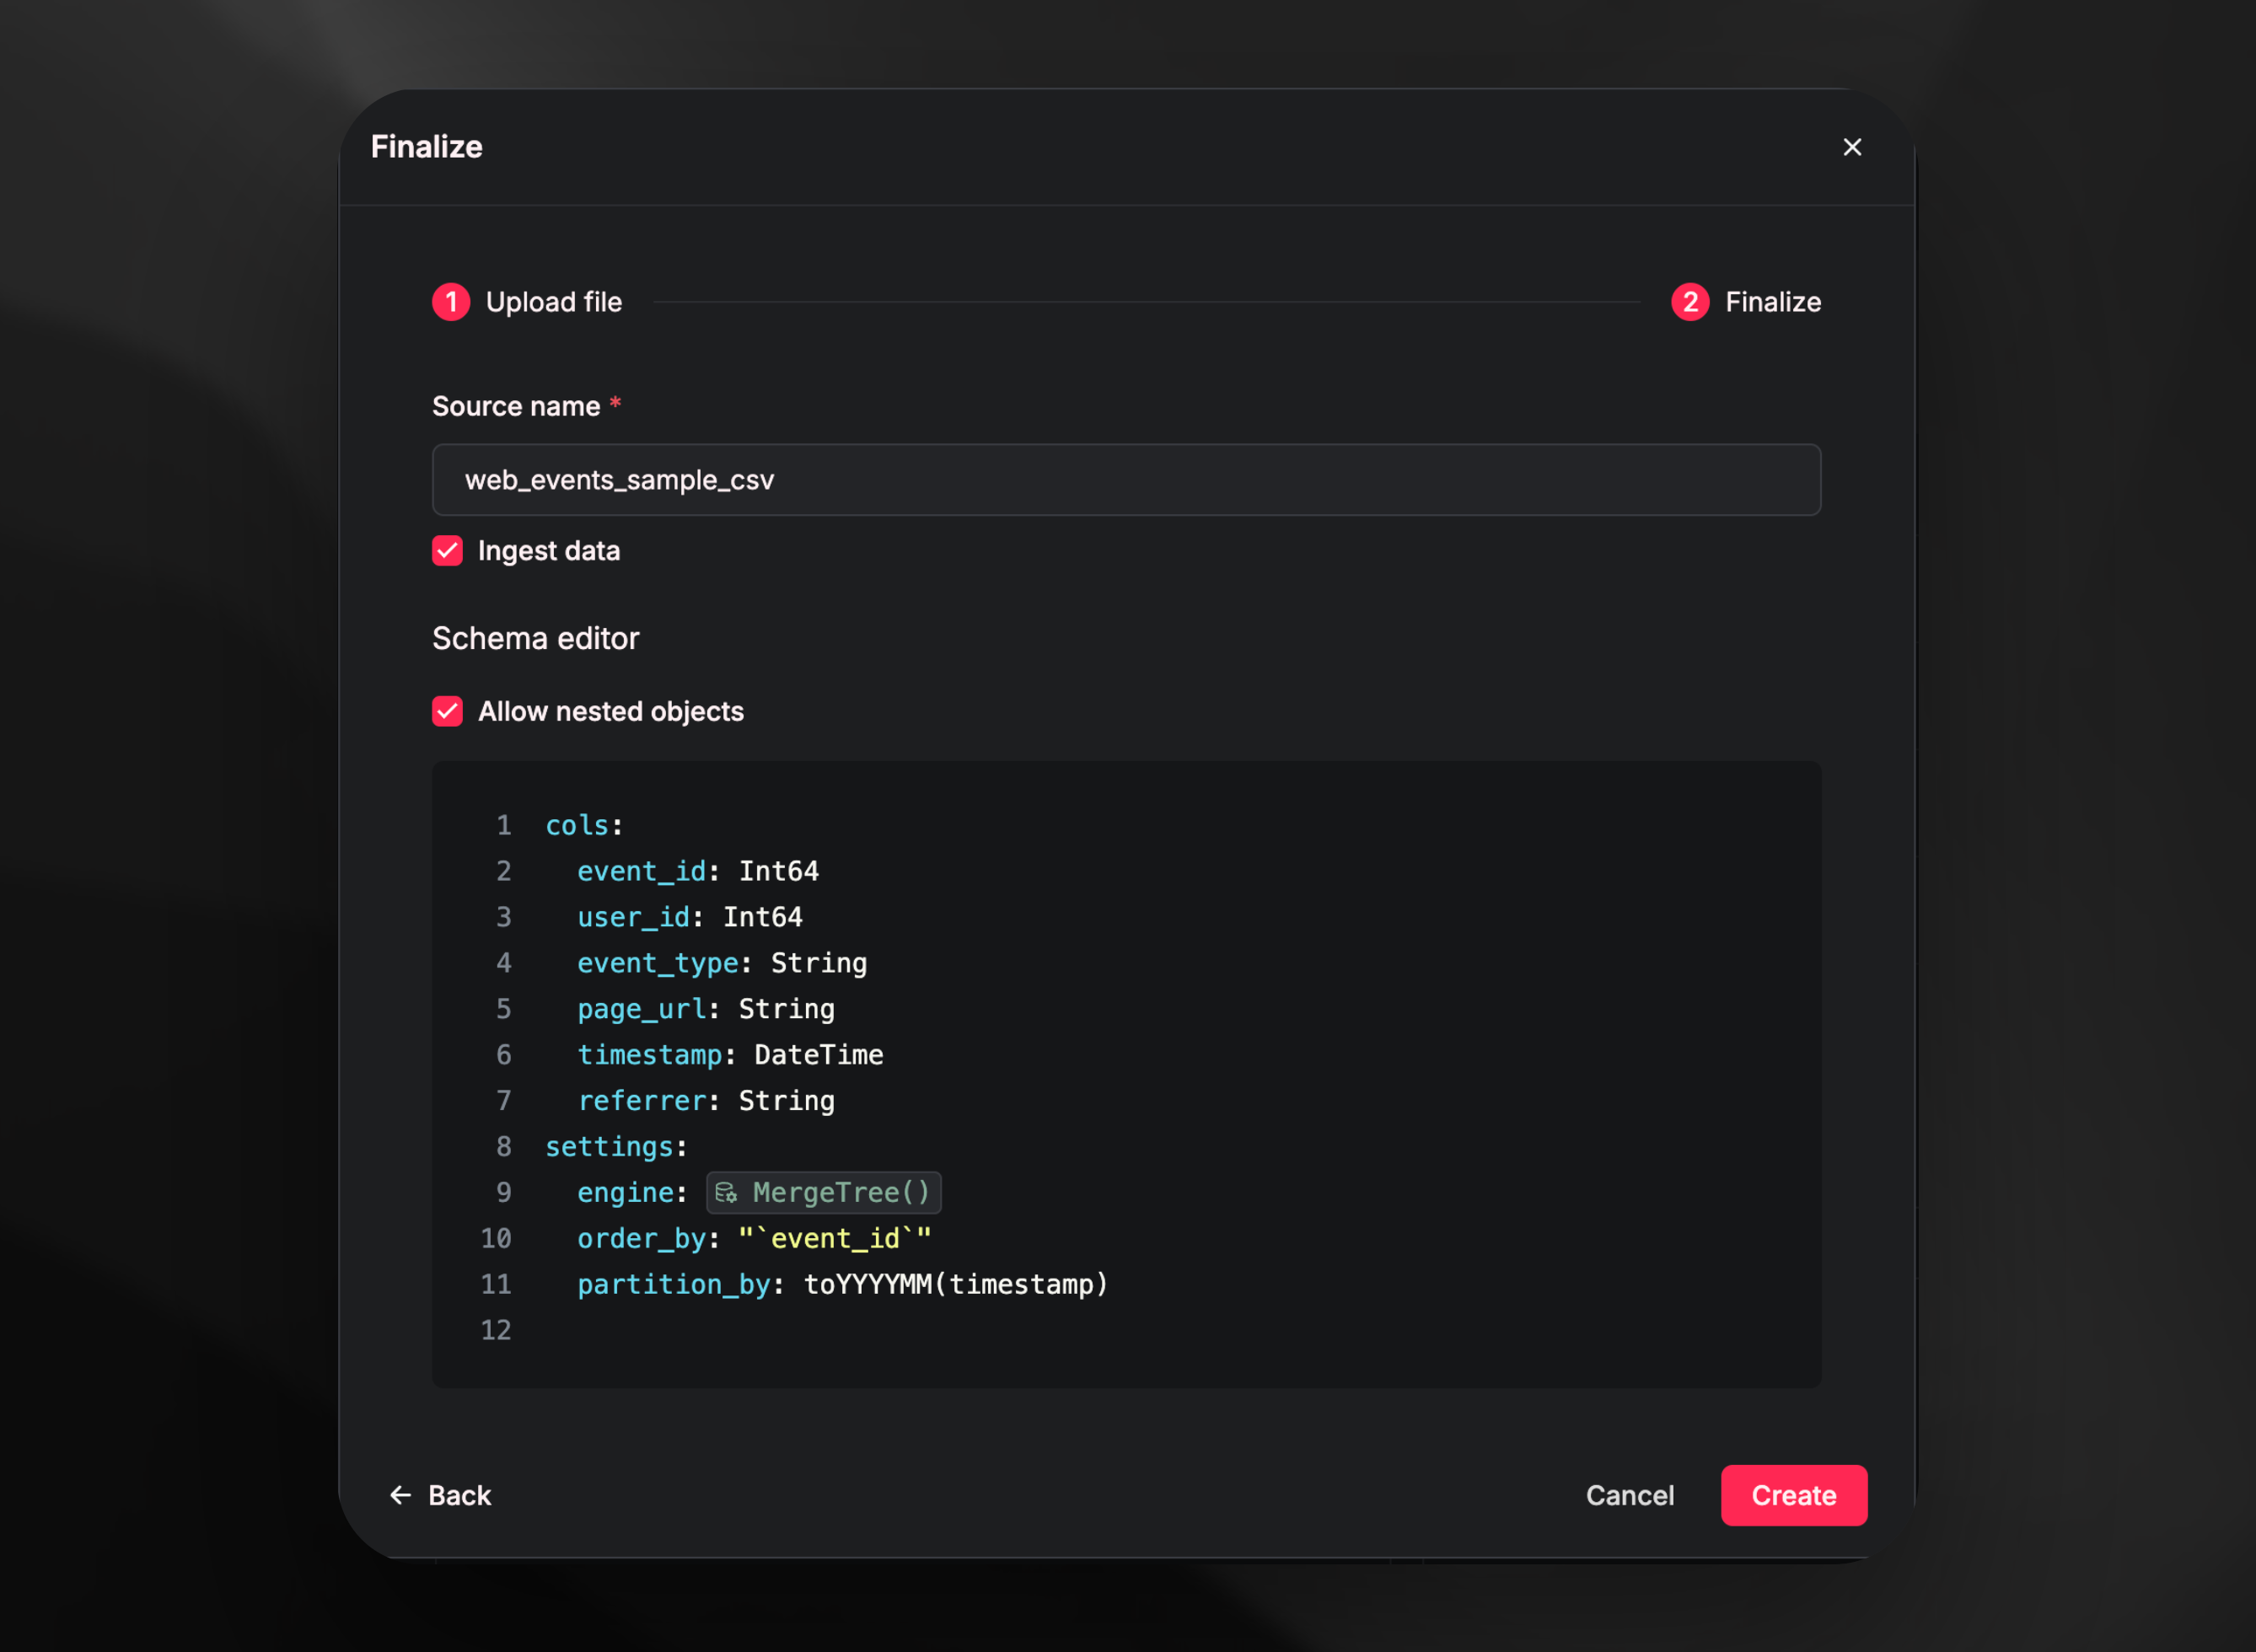 Within a few seconds, all of the data should be ingested.
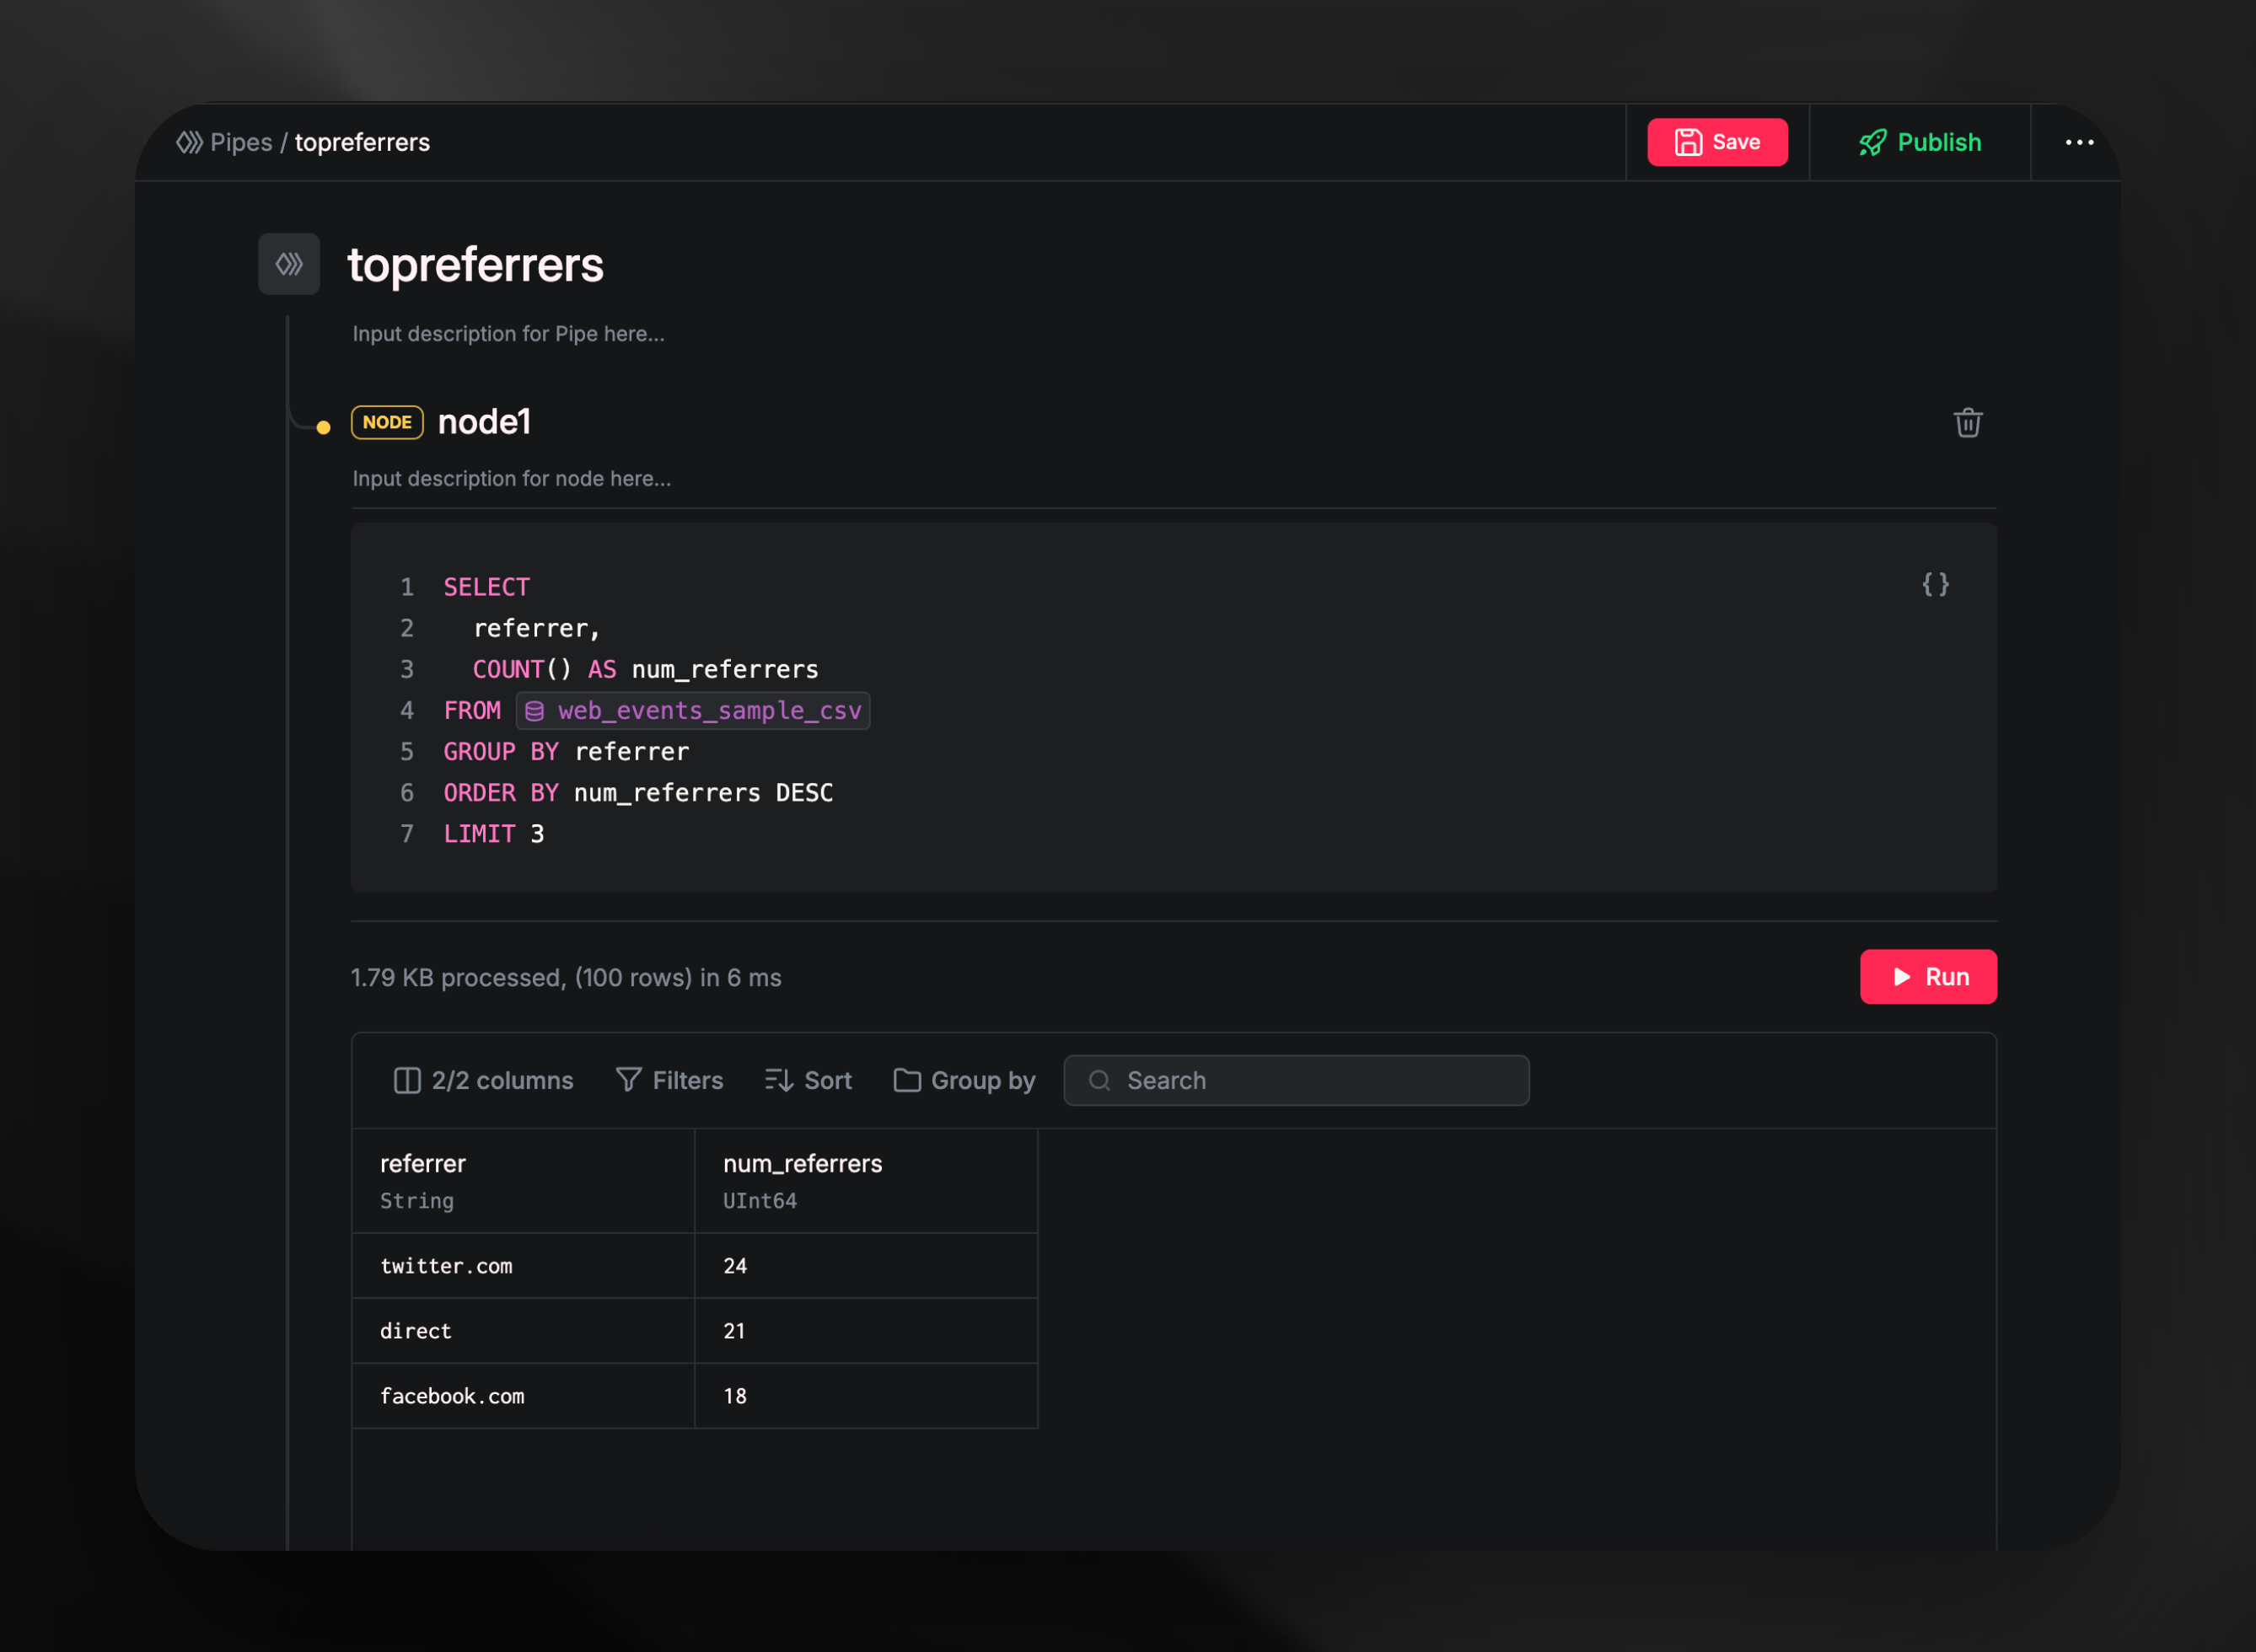
Writing queries as features
Now, we can start querying the data to filter, transform, or aggregate data and do analytics, simple as that. Start by creating a pipe by clicking on “Pipes”, then typing in nametopreferrers.
Once created, add the below query inside the node and run to get the results.
Exposing the features through an API
Once completed, you can click onPublish to publish the query as an endpoint.
You can view the endpoint once it’s published.
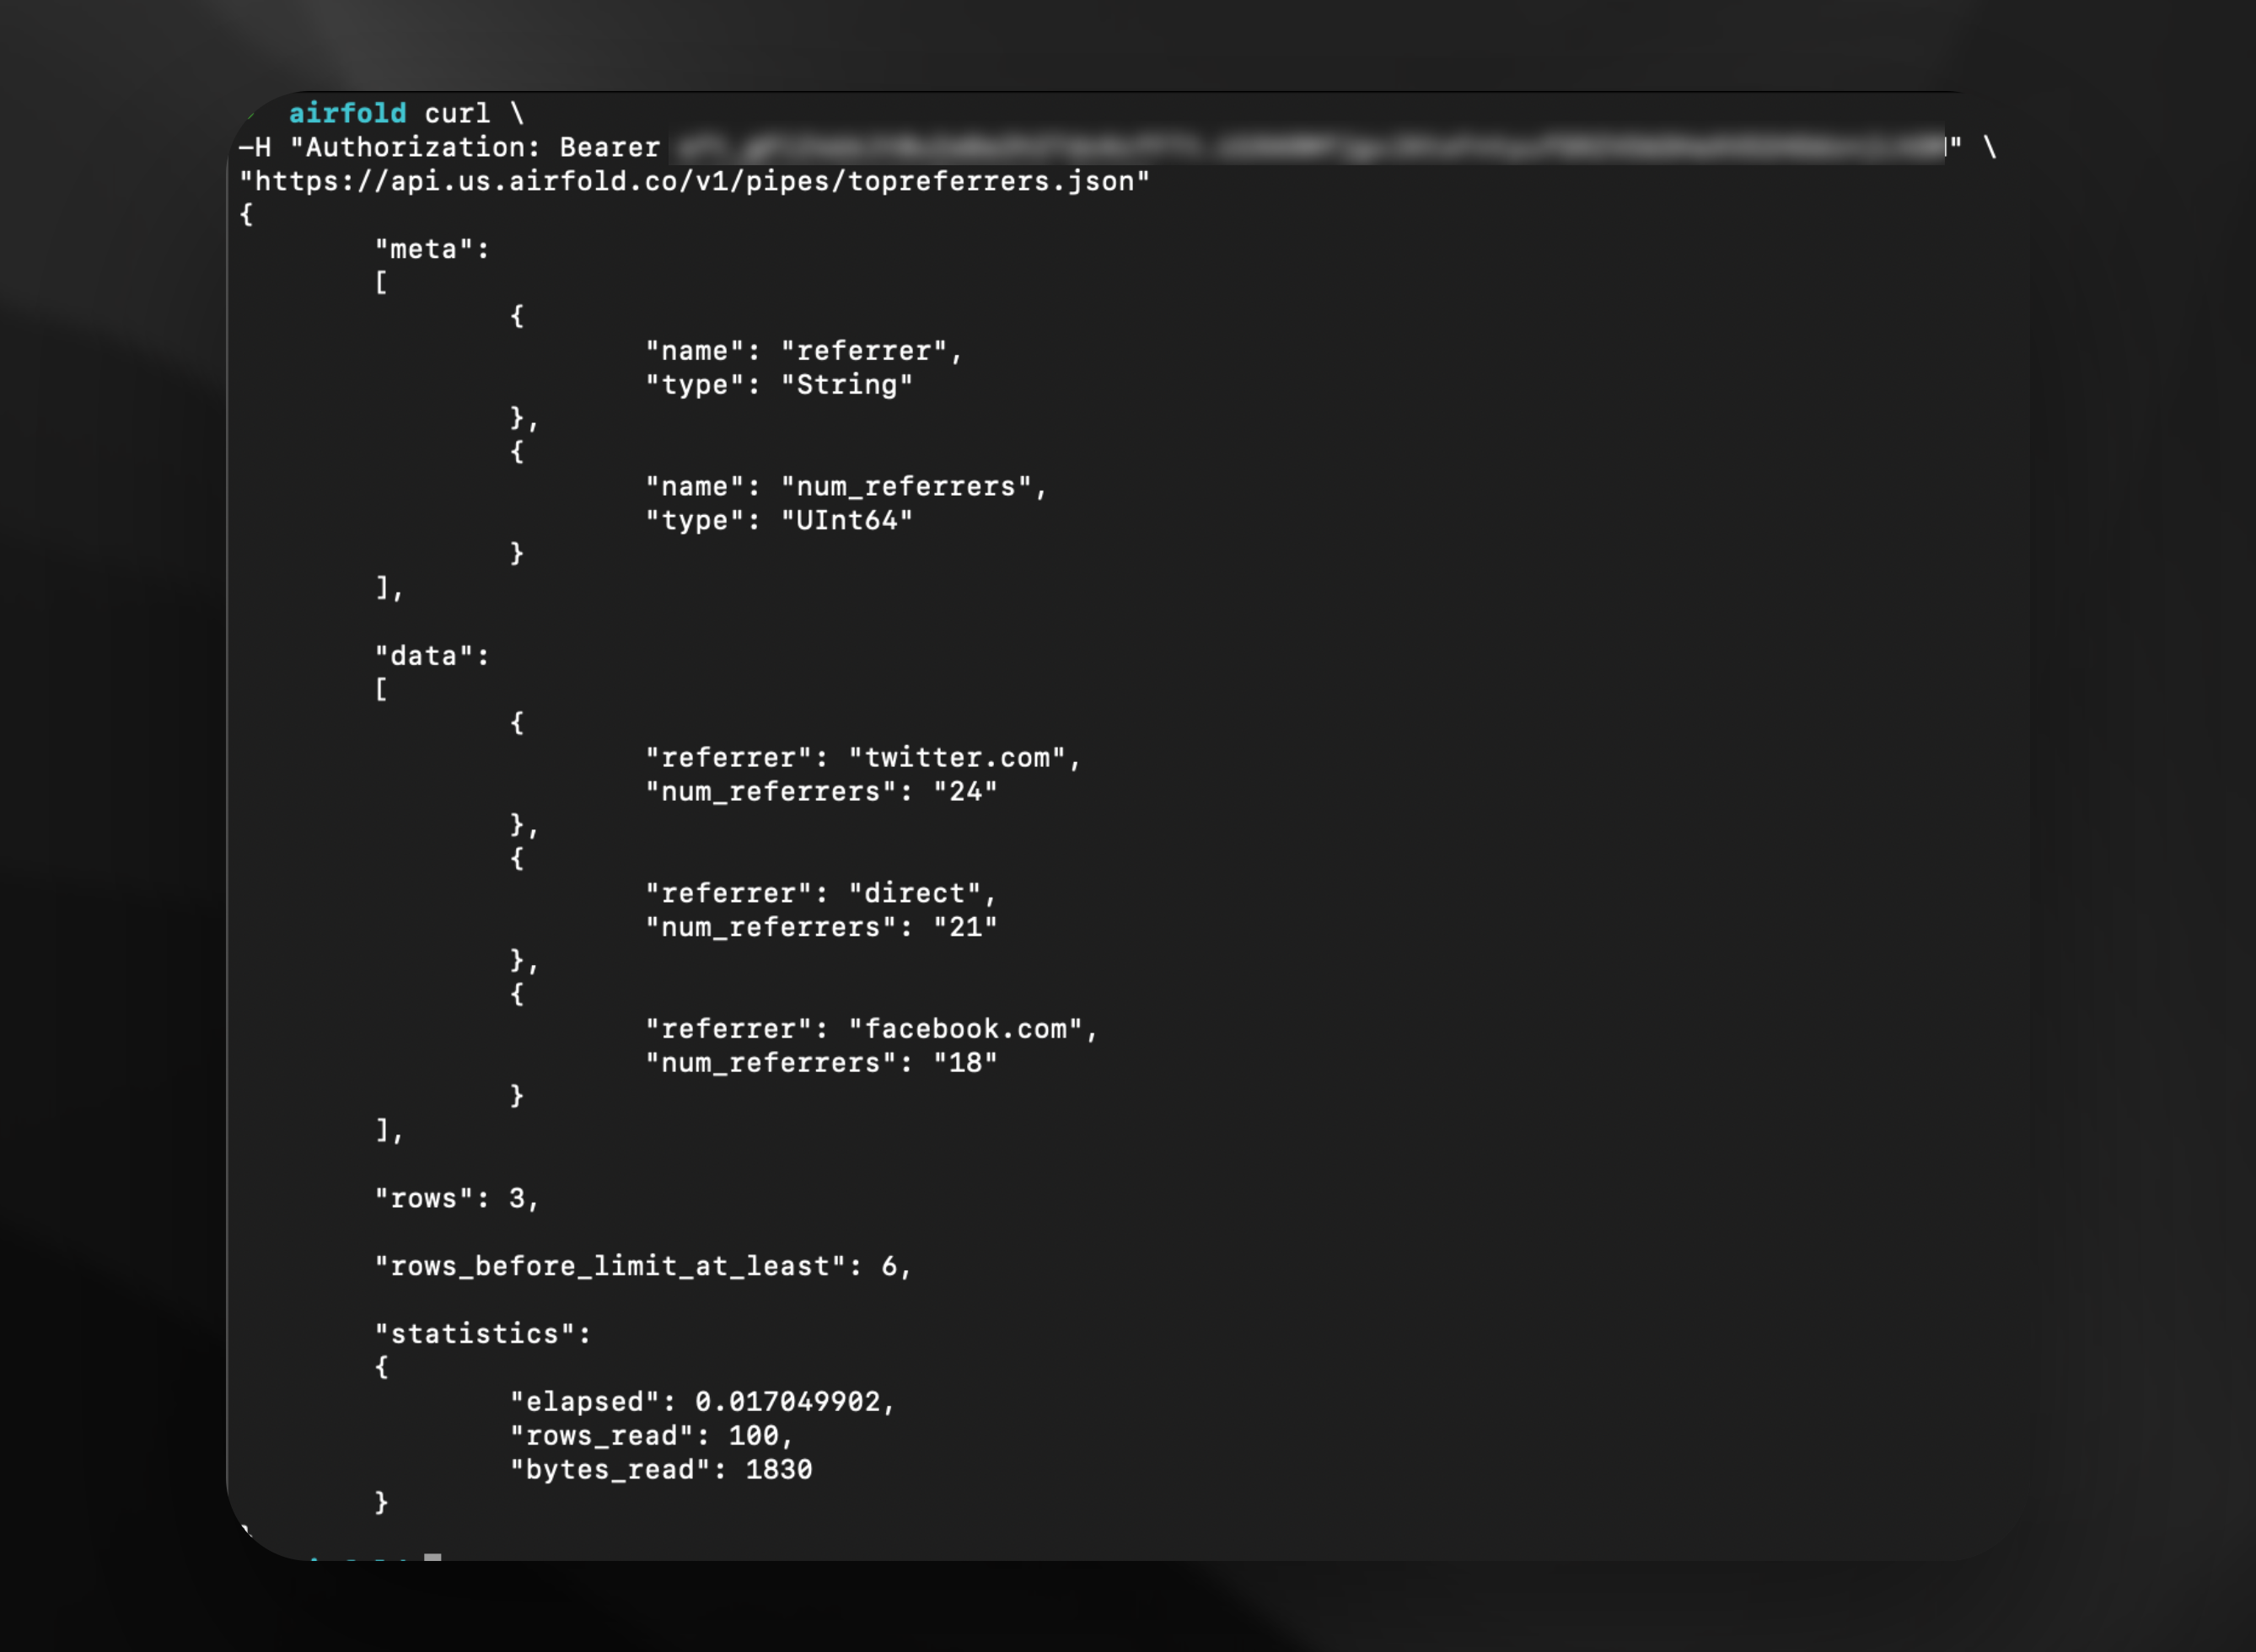
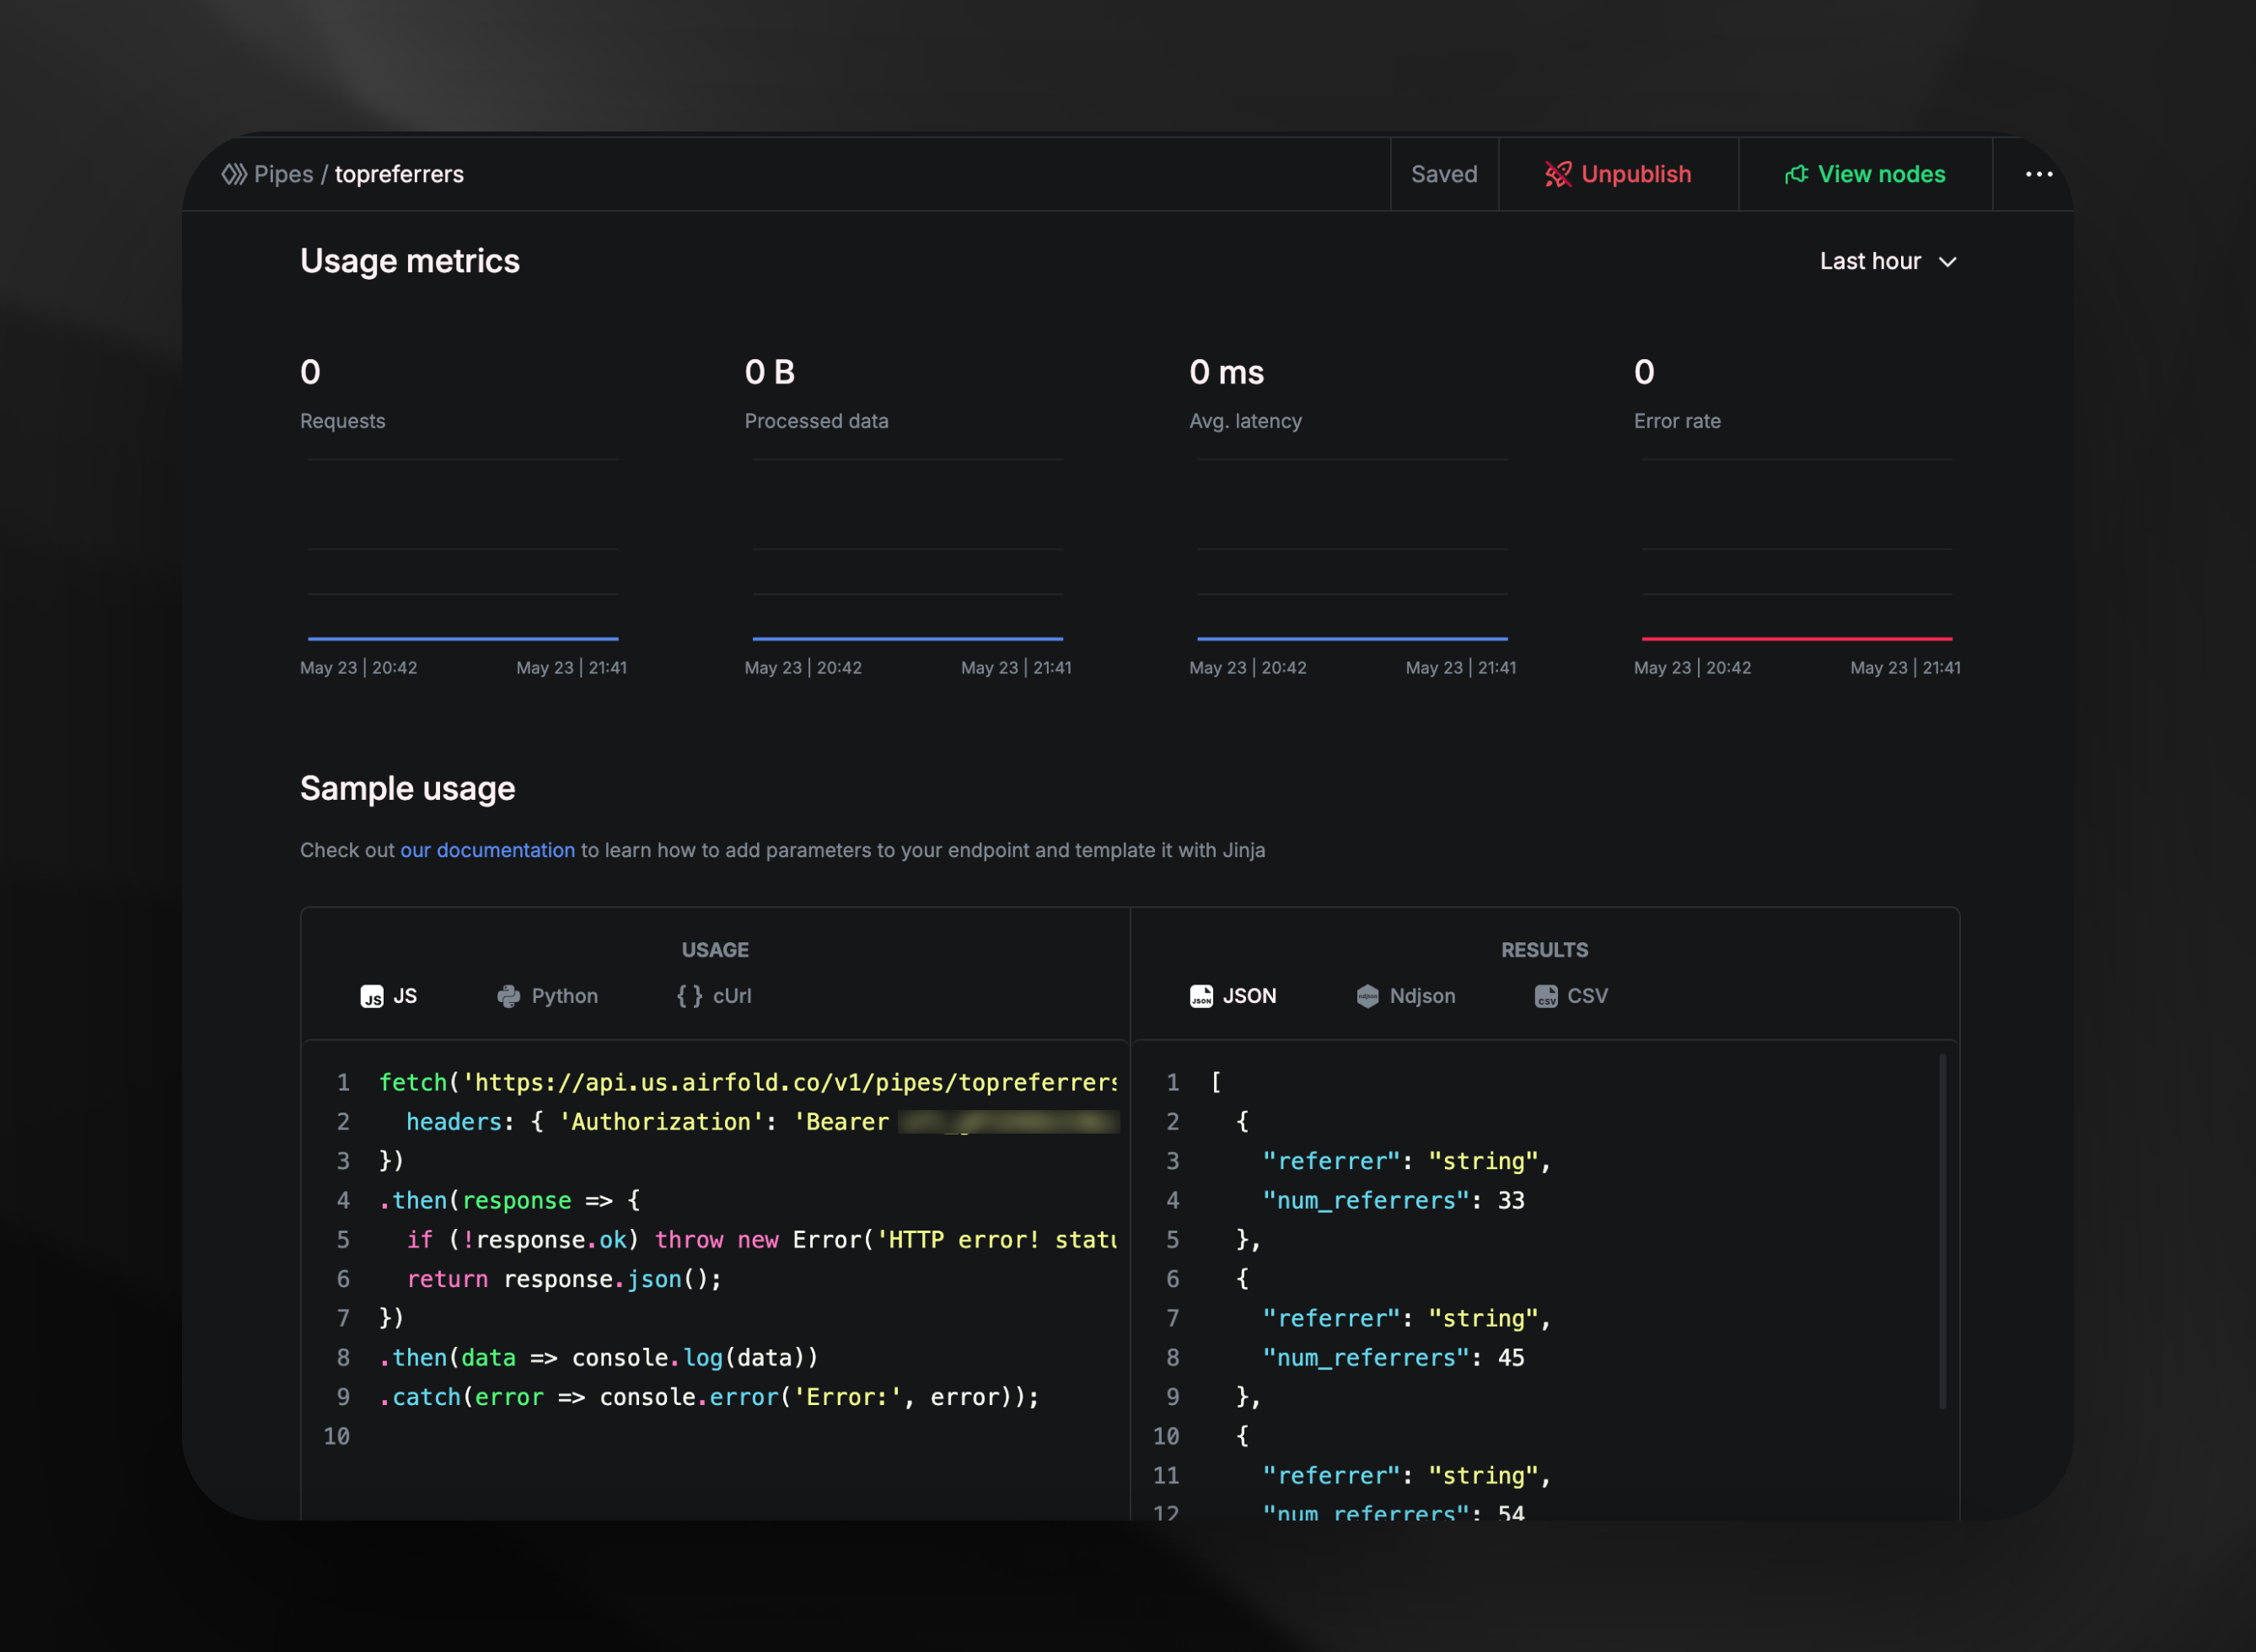 From here, you can use your endpoint in JavaScript, Python, or cUrl by simply copying and pasting.
 You can also unpublish your endpoint anytime by clicking “Unpublish”.